In his book Principles, Ray Dalio called diversification the “Holy Grail of Investing”, used the following chart to illustrate this Holy Grail, and made the following comments about this chart:
“That simple chart struck me with the same force I imagine Einstein must have felt when he discovered E=mc2: I saw that with fifteen to twenty good, uncorrelated return streams, I could dramatically reduce my risks without reducing my expected returns… I called it the “Holy Grail of Investing” because it showed the path to making a fortune.”
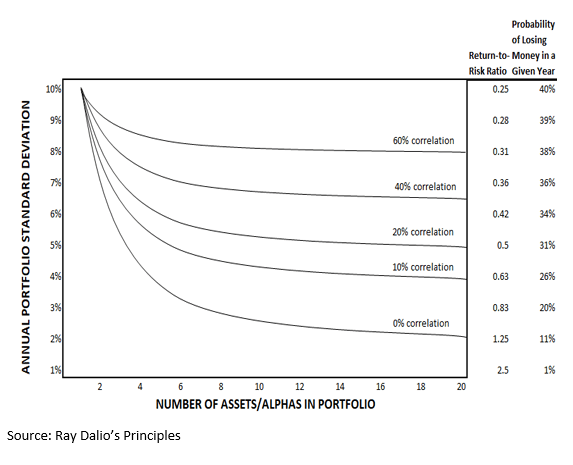
What is the path, precisely? It shows that if one can find 15+ uncorrelated assets/alphas and put them in a portfolio, then the probability of losing money in any given year goes down to 11%.
Why is this so? It is because as you add uncorrelated assets the edge in the portfolio increases, while the volatility in the portfolio DECREASES as the uncorrelated assets buffer each other.
The difficulty most Financial Advisors have in applying these principles to their portfolio’s is that the average stock is 20% correlated with every other stock. Worse yet, in the worst 1% sell offs, that correlation spikes to 87% providing virtually no protection whatsoever!
Even diversifying into Bonds is no sure thing – in the worst crash scenario they are going down too – just not as badly as the rest of the market.
So what to do? There seems to be no easy answer. Notice that the lowest correlation plotted on the Holy Grail chart is the 0% correlation line. What if we could find Assets/Alphas that are not only at or near 0, but occasionally NEGATIVELY CORRELATED? Then we would not need 15 assets to dramatically reduce our risk of a losing year – we could make do with far fewer.
As a quantitative investor, we aren’t limited to investing in individual stocks. We can diversify not only across asset classes, but across time horizons, long/short, and strategy type. If we do so, we can come up with Assets/Alphas that are not only low correlated, but are NEGATIVELY correlated.
Below is a partial correlation matrix of Bishop Financial Services Assets/Alphas:
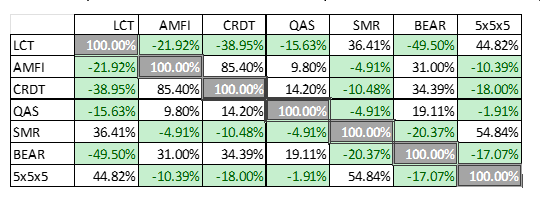
These negative correlation values are very powerful – and when put together in a portfolio they produce a smooth equity curve with high sharpe values that can be leveraged to provide market-beating returns.
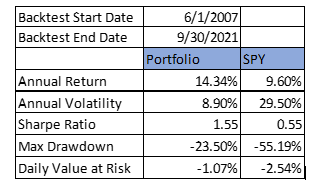
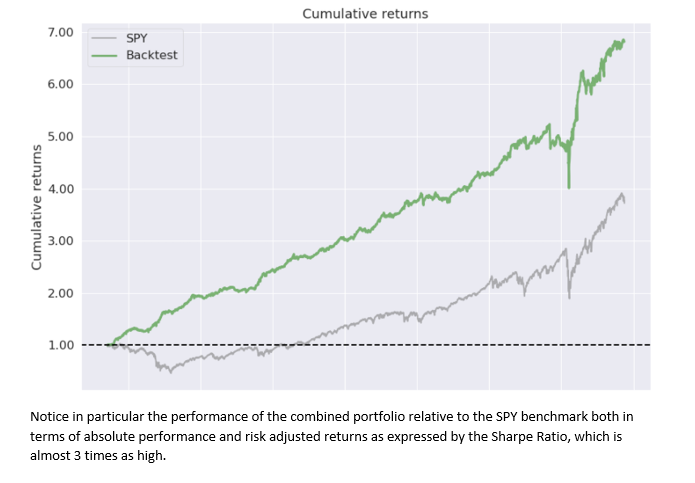
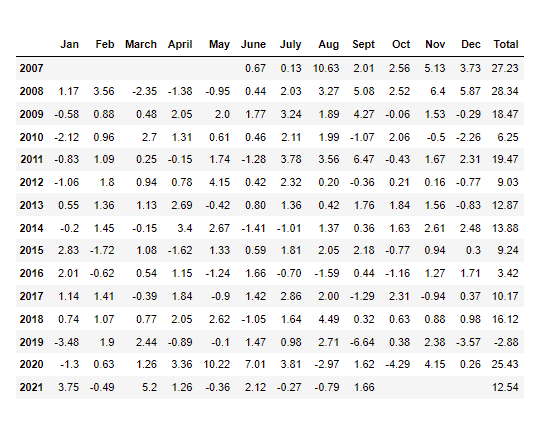
The returns are also quite respectable – with only losing year in the backtest period. We are seeing empirically what Ray Dalio’s “…path to making a fortune.” said we should see.
It’s impossible to create the perfect strategy to “beat the markets”. However, we can put as many uncorrelated alphas together in the same portfolio as possible and that will give us the holy grail of investing – the smooth upwardly sloping equity curve.
DISCLOSURES
Bishop Financial Services, LLC is a registered investment adviser. Information presented is for educational purposes only and does not intend to make an offer or solicitation for the sale or purchase of any specific securities, investments, or investment strategies. Investments involve risk and, unless otherwise stated, are not guaranteed. Be sure to first consult with a qualified financial adviser and/or tax professional before implementing any strategy discussed herein. Past performance is not indicative of future performance.
High Sharpe Portfolio Performance Disclosure: Readers of the information contained on this presentation should be aware that any action taken by the viewer/reader based on this information is taken at their own risk. This information does not address individual situations and should not be construed or viewed as any typed of individual or group recommendation. Be sure to first consult with a qualified financial adviser, tax professional, and/or legal counsel before implementing any securities, investments, or investment strategies discussed. Any performance shown for the relevant time periods is based on backtested results applying the quantitative methods of Bishop Financial Services LLC investment process.
Portfolio performance is shown net of the advisory fees of 2.00% for the Portfolio, the highest fee charged for accounts managed by Bishop Financial Services, LLC and trading costs based on our Custodian’s [Interactive Brokers] trading costs. Performance does not include the deduction of other fees or expenses, including but not limited to margin expenses or income. Performance results shown do include the reinvestment of dividends.
The data used to calculate the portfolio performance was obtained from sources deemed reliable and then organized and presented by Bishop Financial Services, LLC. The performance calculations have not been audited by any third party. Actual performance of client portfolios may differ materially due to the timing related to additional client deposits or withdrawals and the actual deployment and investment of a client portfolio, the length of time various positions are held, the client’s objectives and restrictions, and fees and expenses incurred by any specific individual portfolio. Benchmarks: The Portfolio performance results shown are compared to the performance of the SPY ETF (S&P 500 Exchange Traded Fund). The index results do not reflect fees and expenses.
Return Comparison: The SPY Benchmark was chosen to reflect performance of the broad market.
PAST PERFORMANCE IS NO GUARANTEE OF FUTURE RESULTS