Quantitative trading requires good data to build a good strategy. Publicly available data from Yahoo and Google makes the problem seem tantalizingly simple – yet there are some real pitfalls for the unwary that make the data unusable for all but casual users.
The first major issue is Corporate Actions. If you look at the price of Amazon as of 12/31/1998 you will find a reported price of 4.145833.
Obviously AMZN did not trade at this price – this is a result of a subsequent stock split(s), and prices have been backward adjusted to maintain continuity. Volume numbers are similarly adjusted to make them consistent with reported splits.
This is good from an investor perspective trying to judge relative prices and volumes today vs some period years ago, but not very useful for judging things like whether there is enough liquidity in a stock to make it worthwhile trading. For example – we may need to know exactly how many shares trade on average, not the adjusted number of shares, to be able to judge whether there is enough volume in a stock to minimize the market impact of taking a position.
Similarly, a problem arises for the quantitative trader when we want to put a hard limit on buying at the unadjusted price and able to test if the market reached that price on a given day.
Fortunately there exists commercially available data that preserves unadjusted price and and volume information.
I’ll describe another problem that exists in the free data. Let’s say y0u come up with a hypothesis that says the banking sector is “Too Big To Fail”, and that whenever a crisis hits, the Government is going to GO BIG and BAIL THEM OUT.
You aren’t foolish enough to put money on that without testing it, right?
RIGHT????
Good. So let’s look at all the investment banks round 2008 and buy them. You go to Yahoo Finance and type “banks” and get a list of 52 banks to test in that 2008 period.
Wow! Your results are Fantastic!
Every bank you look at took some heat but eventually turned out GREAT!
JP Morgan, Bank of America, Goldman Sachs, Well Fargo – All of them did GREAT!
In fact, EVERY bank you test did great.
We are good to go right?
Not so fast.
If you happen to have lived through the 2008 Housing Crisis in real time, you might have some suspicions as to why out strategy may not be as good as it initially appears according to our research.
The reason our results look so good is that publicly available databases like Yahoo Finance and Google only include companies that are available today – they DO NOT include companies that have gone bankrupt.
Therefore – if we pick a list of companies today and see how they did back in the 2008 financial crisis, OF COURSE they are going to do fine!
But what about Bear Stearns? What about Lehman Brothers?
Here’s what their stock prices looked like at the time.
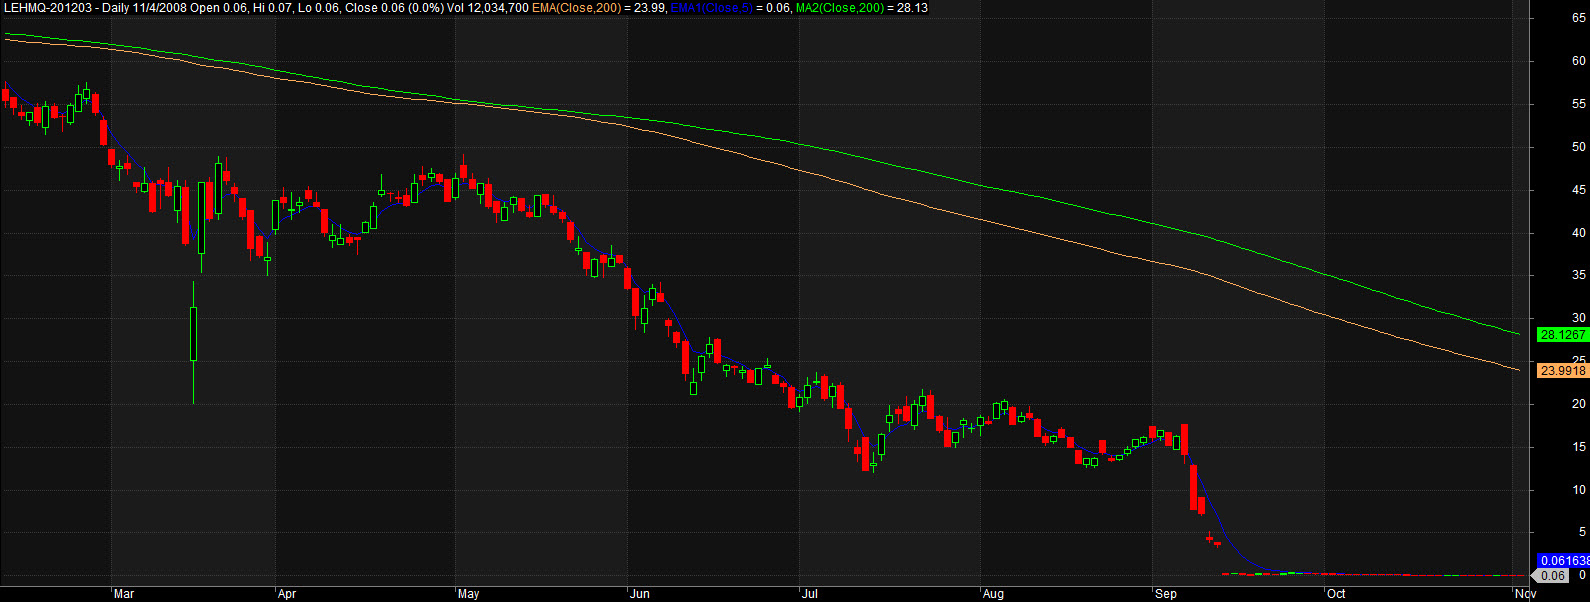
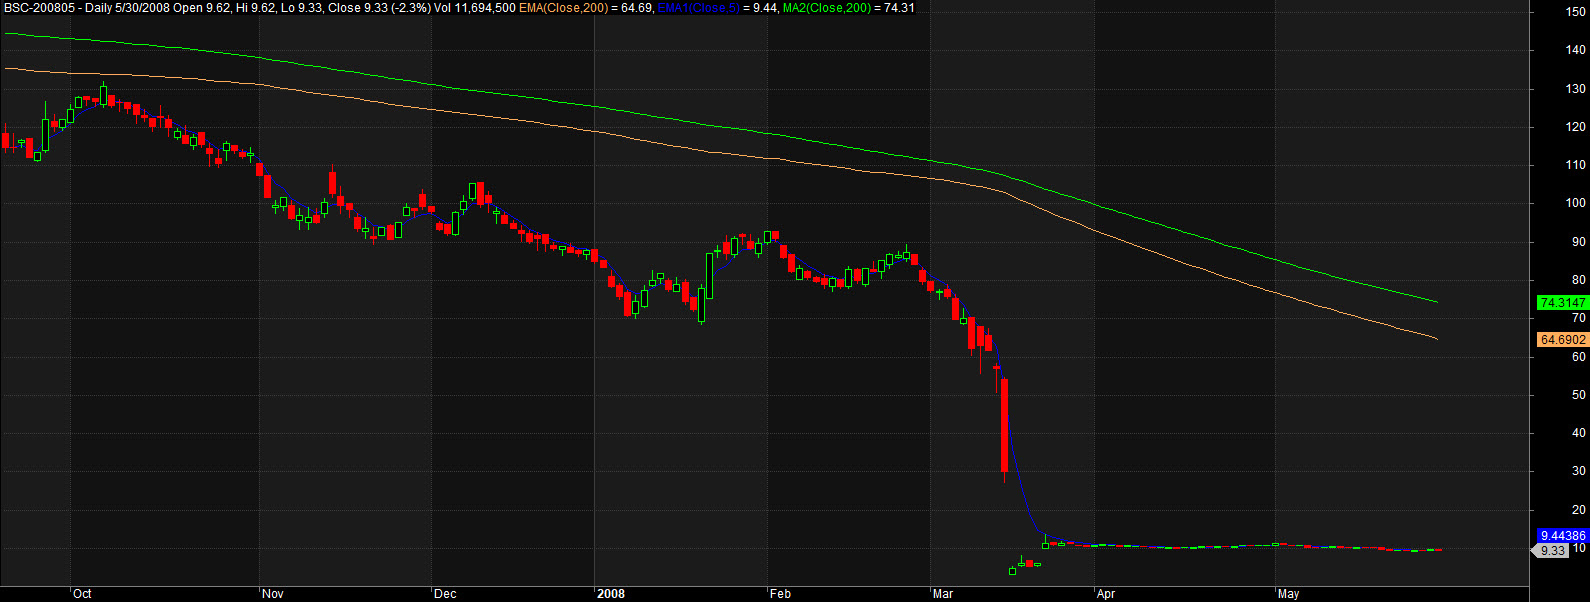
Imagine we had bought a basket of bank stocks based on our earlier ‘research’ and got stuck in either one of these? It would NOT have been fun.
This problem is, fortunately, well known – and databases that suffer from it are said to have a Survivorship Bias.
Another major strategy decision that greatly affects performance is the universe of symbols appropriate for the strategy. Many times a component of this choice will be a major index such as the S&P 500, Russell 3000, Nasdaq 100, or similar index. The important thing to note here is that these indices need to be accurate for your strategies to be accurate – and these indices are not static. The index membership actually changes quite regularly and significantly over the years so it is important for the data provider to get this right. Yahoo and Google give you current index membership – but not membership on a given day in the past, which is what you need if you are going to do strategy research.
I hope I’ve opened a few eyes on something as “simple” as data – there are more than a few data gotcha’s – but they can’t harm you if you are aware of them.