A major realization the new quantitative investor encounters is that while we do everything in our power to ensure we are investing in strategies with edge taking advantage of timeless market behaviors, to the uninitiated this looks awfully like “market timing”. This should raise serious some serious doubts because of course we are all told our entire adult lives that “you can’t time the market”.
If a strategy is quantitative, it is by definition “market timing”, because how can it be objectively quantitative unless there are rules for when to enter and exit the market?
It is therefore not a question of whether “market timing” works, per se, but whether quantitative strategies work in general that is the real question. The hedge fund AQR decided to tackle this question head on for the Trend Following family of strategies going back 100 years and got some eye-opening and spectacular results.
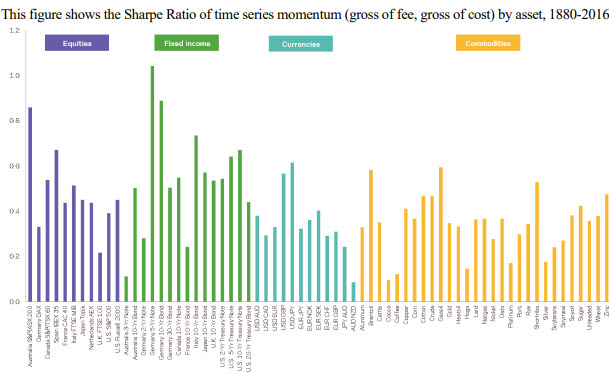
Before we look at the below table, keep in mind that the Sharpe Ratio of the SP 500 over a 10 year period is typically .5. The higher the number, the better, and it measures return for risk taken.
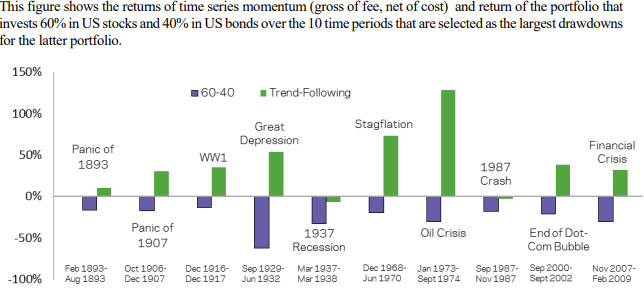
The important thing to note is that there are no negative returns regardless of the asset tested. That is a powerful hint that we may be looking at a fundamental market behavior – but the authors went a step further and compared the momentum trend following portfolio to a 60/40 equities+bonds portfolio.
Wow. The trend following ALWAYS beats the 60/40 portfolio. ALWAYS. Makes you wonder why those people are telling you that you can’t time the market, doesn’t it?
Of particular note is the overperformance in the Dec1968-Jun1970 period labelled “Stagflation” – the market is poised to go through similar trying times and I believe those managers that know how to construct portfolios that protect against this environment and can take advantage of the coming volatility will do well, while your more typical “60/40” managers will suffer greatly.
Why do we often hear “You can’t time the market?” In my opinion it is because most people can’t. Most of them can’t even beat their benchmark portfolios consistently. Yet here we have a study going back 100 years that not only beats the standard 60/40 balanced portfolio using one of the most basic trend following strategies possible, it does it quite handily.
As of 3/31/21 the calculated value of the Sharpe Ratio of the High Sharpe Fund was 1.85, which is reaching hedge fund values and very rare for financial advisor accounts. This is an extremely competitive and high-performance fund.
The Quantum Return Portfolio (which is unleveraged and suitable for IRAs) is reporting a Sharpe value of 1.12. This is also extremely competitive, especially for a non-leveraged portfolio.
Both portfolios are ideal for investors looking for maximum returns for a minimum of risk.
Graphs from: Hurst, Brian and Ooi, Yao Hua and Pedersen, Lasse Heje, A Century of Evidence on Trend-Following Investing (June 27, 2017)
For those interested in the entire research paper, you may download it here.


